单线图这类数据线图是DI题型常考的题目,今天羊驼在线老师给大家带来的是经典的单线图例题讲解,不仅会教大家如何从数据图中提取关键词,还有模板及其使用方法讲解,我们一起看下去吧。
题目:

解析:Sample answer:
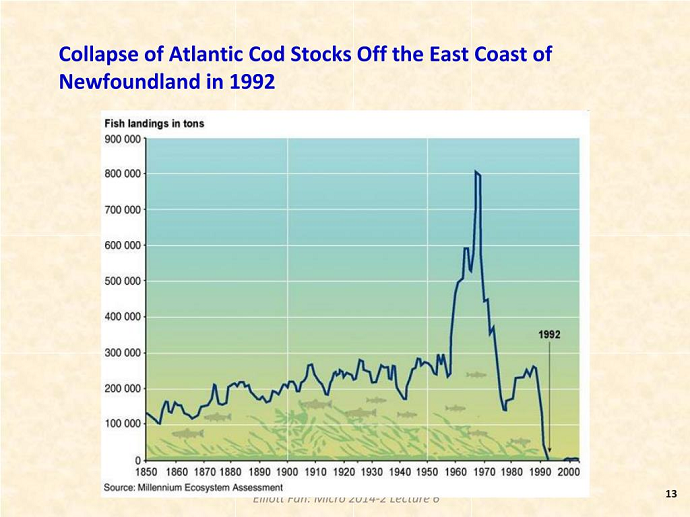
Title: Collapse of Atlantic Cod Stocks Off the East Coast of Newfoundland in 1992
Largest number: eight hundred thousand, 1970
Smallest number: zero, 1992
Conclusion: Fish landings in tons, increase, decrease
第一部分:PTE口语DI题型关键词提取示范

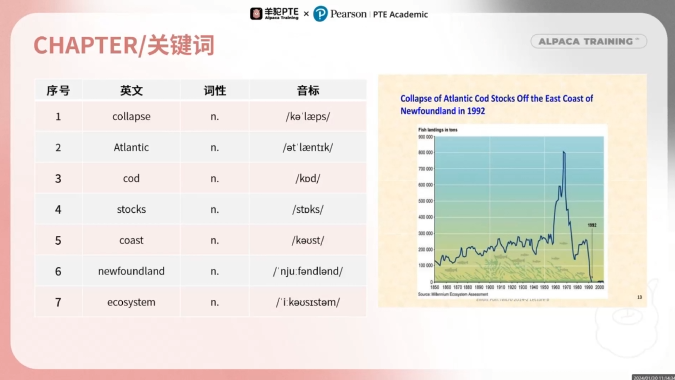
上图是Collapse of Atlantic Cod Stocks的关键词提取示范,我们来详细讲解:
1)collapse,表示崩溃、崩盘或暴跌,在这道例题中表示鳕鱼种群数量的锐减,注意其重音在中间,/kəˈlæps/;
2)Atlantic,/ətˈlæntɪk/,大西洋;
3)cod,/kɒd/,鳕鱼;
4)stocks,/stɒks/,库存量、存货;
5)coast,海岸,/kəʊst/注意其中的是双元音O的音;
6)Newfoundland,这个词英音美音发音不同,英音为/ˈnjuːfəndlənd/,美音为/njʊˈfaʊndlənd/,注意区分;
7)ecosystem,生态系统,重音在第一个音节。
另外,需要关注图表中的横纵坐标对应内容:
纵坐标对应鳕鱼的存量,以吨为单位,在读的时候需要确定数字的位数,每三位数用逗号标记,一个逗号读thousand,两个逗号读million,重视数字读法。
横坐标为对应的年份,在读的时候可以使用两位数的读法,例如Eighteen ninety、Nineteen twenty,注意teen和ty的区别。
第二部分:PTE口语DI题型数据图模板

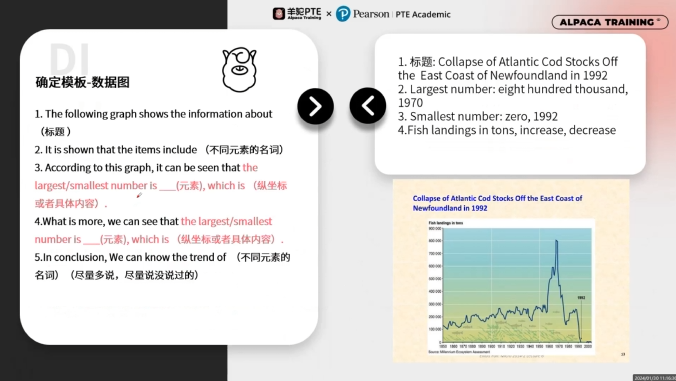
上图为这道数据图例题适用的模板,这是一道很经典的单线数据图题,我们可以直接套用模板:
1)第一句话,标题,直接使用图片上方的标题即可;
2)图表描述,可以用到the largest number is (),which is().在前面的空中填入年份,后面表述纵坐标的具体最大数值。套用的重点在于使用年份和数值,不要过多在意语法;
3)在分析时,可以带入横纵坐标对应的单词,如果有不会的单词可以直接避开,但如果出现如图的黑色标注字体,需要重点表达。
4)在准备时间提前预读数字,保持口语流利度。
例文示范:The following graph shows information about the collapse of Atlantic cod stocks off the east coast of Newfoundland in nineteen ninety two.It is shown that items include collapse of cod and years.According to this graph it can be seen that the largest number is nine hundred thousand which is in nineteen.What more we can see that the smallest number is zero which is in nineteen ninety two.In conclusion we can know the trend of the collapse of Atlantic Cod stocks.
相关推荐
热门信息: 2024中国PTE考点一览表 | PTE考试报名流程
知识重点:PTE考试口语技巧 | PTE口语RS题型详解:答题技巧
留学相关:澳洲八大认可PTE成绩吗 | 墨尔本大学PTE成绩要求上涨


